How many weeks before harvest does a yield trend line become reliable?
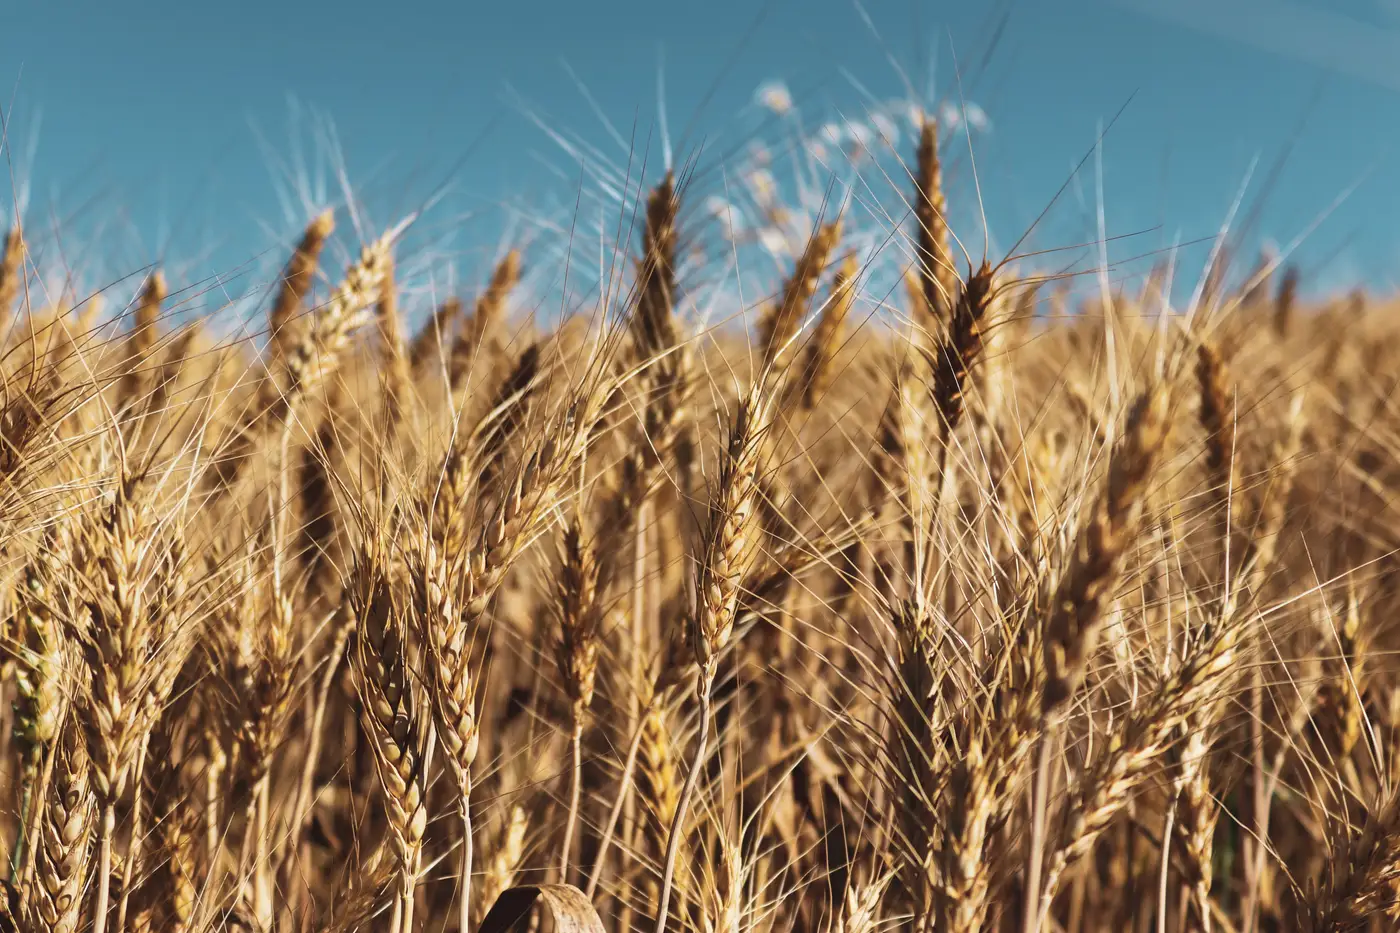
For row crops, the honest answer is somewhere around six to eight weeks before harvest, once the crop is through its reproductive stage and the index curve is tracking grain fill or pod fill instead of planting conditions. For wheat, it moves earlier, closer to heading. Neither number is a guarantee. It is the point where the curve starts carrying more signal than noise.
What the curve is measuring before that point
Early in the season, a vegetation index curve mostly reflects emergence, stand count, and canopy closure. A field that got planted into good moisture and came up even will show a strong early curve. That tells you something about planted area and early crop condition. It does not tell you much about yield, because the variables that actually set yield for corn and soybeans, pollination weather, pod set, grain fill duration, haven't happened yet.
This is the stretch where a lot of early-season chatter gets ahead of the data. A hot start to the index curve in late May gets read as a big crop before the crop has even tasseled. By the time silking or pod set happens, a dry two-week stretch can flatten that same curve, and the early read turns out to have measured germination, not bushels.
Where the curve starts to hold up
Once a crop sets its yield components, the index curve starts correlating with historical yield in a way that holds up for a production call. For corn, that's roughly after silking. For soybeans, after pod set. For wheat, the window opens earlier, around heading, because the crop's yield potential locks in sooner. From that point forward, each weekly print narrows the range rather than resetting it. A curve that holds its shape through two or three consecutive weekly passes, with no major weather event in between, is a different kind of signal than a single early-season satellite look.
That's also why one snapshot from mid-July doesn't replace a weekly trend line in September. A single pass is a photo of the field on one day. The trend line is what the field did over the stretch of weeks that determined yield, regressed against how that same index curve has behaved in prior crop years for the same region.
Why the last few weeks still matter
Even inside that six-to-eight-week window, the estimate keeps moving, and it should. Harvested area can diverge from planted area as the season goes, late-season disease or lodging shows up in the index after it shows up in the field, and a dry finish can clip top-end yield after the bulk of grain fill is already locked in. A regional estimate built off week six is a reasonable starting point for a production call. The same estimate built off week two is built off wind, moisture, and emergence, not yield.
So the practical rule for anyone making a production call ahead of harvest: treat anything before the reproductive stage as a planted-area and early-condition read, not a yield read, and start weighting the trend line once the crop has set its yield components and a few weekly prints have confirmed the direction. If the curve is still trending with the historical season-to-date pattern six weeks out, that's a trend line worth basing a basis call on. If it's three weeks past planting, it's worth watching, not calling.
That's the gap a weekly regional production call is built to close, regressing the current index curve against historical yield region by region, refreshed every week instead of once at season's end. If you're staring down a production call and want the trend line as it stands this week, not a guess from early June, that's what Yield Forecasting runs.